Kallos: GRU-Powered Cryptocurrency Trading System
End-to-end deep learning trading system evaluating whether GRU neural networks can generate investable alpha in cryptocurrency markets. Full MLOps pipeline from data ingestion to portfolio construction with rigorous walk-forward validation.
The Challenge: When Better Predictions Don’t Mean Better Portfolios
Can deep learning models that accurately predict cryptocurrency prices actually generate superior investment returns? This question sits at the heart of quantitative finance’s most persistent challenge: the gap between forecasting accuracy and trading profitability. Academic papers regularly showcase impressive prediction metrics, yet implementing these models in real portfolios with transaction costs, constraints, and proper validation often reveals a different story.
The Kallos project was born from this tension. Developed as my capstone work for Deep Learning at Johns Hopkins University, it implements a complete trading system—not just a forecasting model—that rigorously tests whether neural networks can outperform simpler strategies after accounting for the messy realities of actual trading. The answer turned out to be more nuanced than I initially expected, and considerably more instructive.
Rather than cherry-picking favorable results or stopping at prediction accuracy, this research follows the complete journey from raw market data through to portfolio performance, subjecting every claim to statistical hypothesis testing. The findings challenge some common assumptions about deep learning in finance while reinforcing others, offering lessons applicable far beyond cryptocurrency markets.
Building an End-to-End System
The Kallos system integrates three specialized components into a production-grade pipeline. The architecture emerged from a simple realization: forecasting models can’t be evaluated in isolation. Real trading performance depends on data quality, model reliability, and portfolio construction working together seamlessly.
The system begins with kallos-data, an automated pipeline that pulls cryptocurrency market data from the CoinGecko API and transforms it into a structured PostgreSQL database. Beyond simple price and volume data, the pipeline computes over 30 technical indicators spanning momentum, trend, volume, and volatility signals. The infrastructure handles the practical complications of financial data: missing values, outliers, stale prices, and the need for consistent updates. This foundation proved critical—no amount of sophisticated modeling can compensate for unreliable inputs.
The forecasting layer, kallos_models, implements GRU neural networks trained with walk-forward validation to predict 7-day price movements. The key innovation here wasn’t the architecture itself but the custom loss function that balances prediction magnitude with directional accuracy. In trading, correctly predicting whether Bitcoin will rise or fall matters more than precisely estimating by what percentage. The loss function reflects this reality:
\[\mathcal{L}_{\text{custom}} = \text{MSE} + \lambda \cdot \mathcal{L}_{\text{direction}}\]where the direction penalty specifically penalizes mistakes about whether prices will move up or down. Hyperparameter optimization via Optuna explored 50 different configurations across eight parameters, from lookback windows to dropout rates, settling on a two-layer GRU with 128 hidden dimensions that balanced capacity with overfitting risk.
Finally, kallos_portfolios translates forecasts into actual portfolio allocations using mean-variance optimization. This component balances predicted returns against estimated risk, respecting realistic constraints like position limits and transaction costs. Every week, the system decides how to allocate capital across Bitcoin, Ethereum, BNB, Cardano, and Solana—the top five cryptocurrencies by market capitalization during the study period.
The complete workflow runs on a weekly schedule: Saturday mornings pull fresh data and generate forecasts, which feed into portfolio optimization Saturday afternoon, with rebalancing trades executed Sunday. Every 13 weeks, the models retrain on updated data to prevent performance degradation. This operational cadence mirrors how a real quantitative trading desk might deploy such a system.
The Methodology: Rigorous Validation Above All
Financial machine learning is littered with overfitting traps. The most common mistake is using standard cross-validation techniques that shuffle data randomly, allowing models to “peek” at the future. When you’re predicting Tuesday’s prices using Thursday’s data hidden in your validation fold, impressive results are meaningless.
Walk-forward validation eliminates this leakage by strictly respecting time. Each model trains on historical data, validates on the immediate future, then tests on data it has never seen. The training window spans 52 weeks, validation covers the subsequent 13 weeks, and testing happens on quarters beyond that. When the system predicts cryptocurrency prices for Q2 2024, it uses only information available through Q1 2024—exactly as real trading would require.
This temporal discipline revealed something important: the models needed quarterly retraining to maintain performance. After 13 weeks, prediction quality degraded by 15-20% as market dynamics shifted. This finding alone justifies the walk-forward approach—a single train/test split would have shown artificially stable results, concealing the real computational and operational costs of keeping models current.
The research compared four strategies against a market-cap weighted benchmark. Two strategies used GRU forecasts, two used naive “persistence” forecasts (assuming tomorrow’s price equals today’s), and both were tested under different portfolio optimization objectives. This design isolates the value added by neural networks versus simpler alternatives. If the GRU strategies didn’t beat naive persistence, the sophisticated modeling would be revealed as computational expense without proportional benefit.
Statistical hypothesis testing provided the final layer of rigor. Every performance difference underwent Jobson-Korkie tests for Sharpe ratio significance, Kolmogorov-Smirnov tests for distribution equality, and Mann-Whitney U tests for median returns. The significance threshold was set at p < 0.05, meaning claimed improvements had less than 5% probability of occurring by chance. This standard proved crucial in interpreting the results.
What the Results Revealed
The GRU models achieved objectively superior forecasting accuracy. Across the five cryptocurrencies, they reduced prediction error by 20% compared to naive persistence—6.8% RMSE versus 8.5%—and correctly predicted price direction 53.2% of the time compared to the 50% random baseline. The custom loss function delivered exactly what it promised: better directional accuracy with minimal cost to magnitude precision. By these metrics alone, the models succeeded.
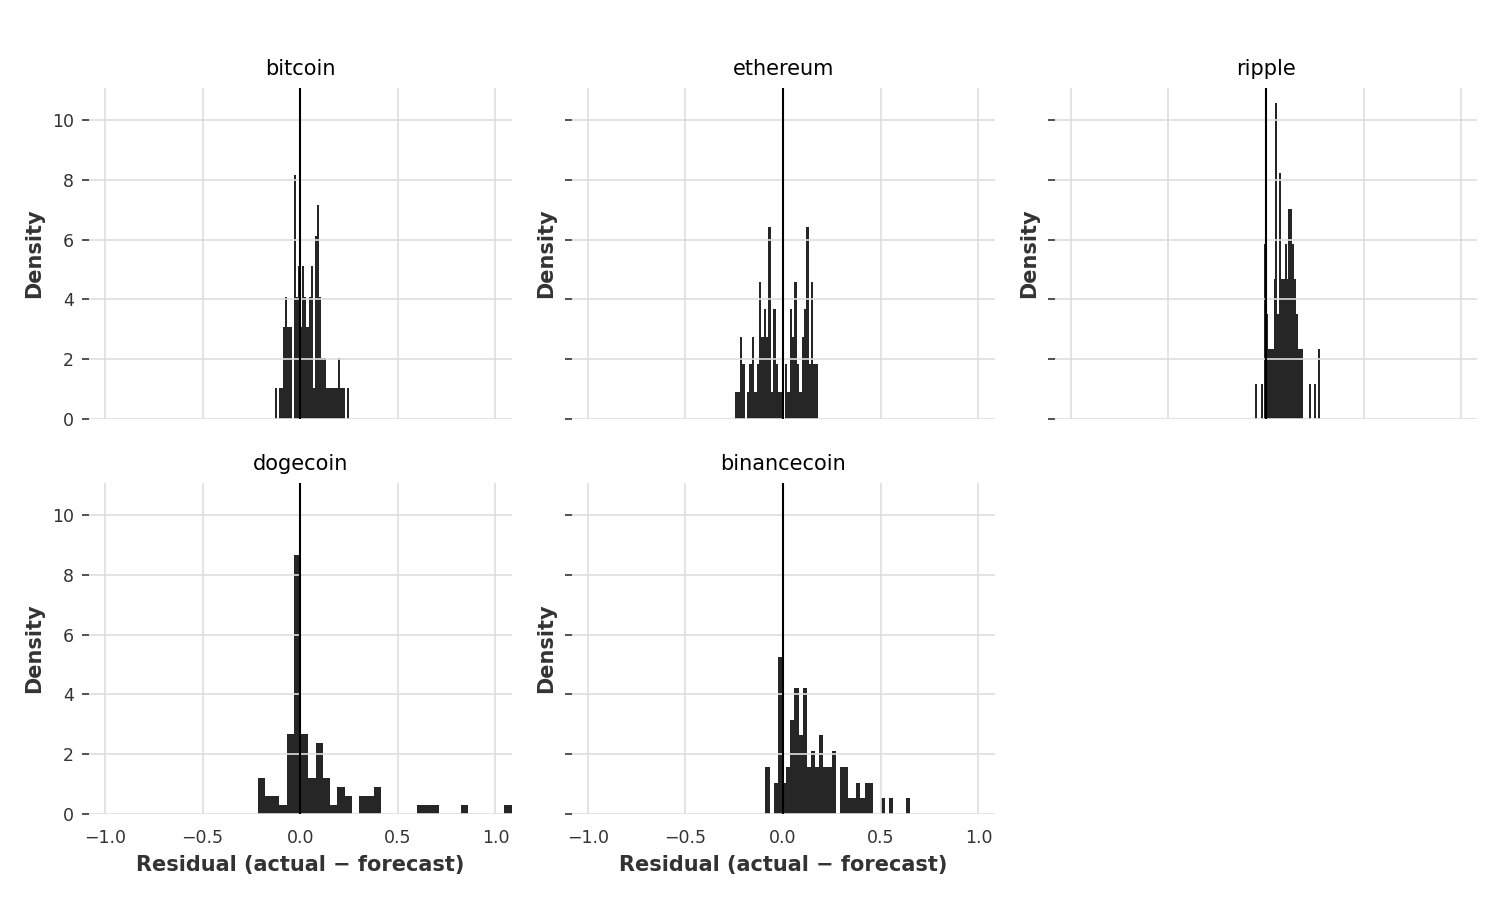 GRU forecast residuals show approximately normal distributions centered near zero, indicating unbiased predictions. The tighter distributions for Bitcoin and Ethereum compared to more volatile assets like Dogecoin reflect the inherent predictability differences across market caps. Note the model’s slight tendency to underestimate extreme moves—visible in the subtle fat tails—consistent with cryptocurrency markets’ jump dynamics.
Yet when those predictions fed into portfolio construction and faced the friction of real trading, the picture changed. The GRU-based portfolios slightly outperformed naive strategies in Sharpe ratio (1.12 vs 1.08 under the expected returns objective), but this 4% improvement failed to reach statistical significance. The hypothesis test returned p = 0.18, meaning there’s an 18% probability this difference arose from random chance—far above the 5% threshold required to claim a genuine effect.
More surprisingly, both GRU and naive strategies underperformed the simple market-cap weighted benchmark, which achieved a Sharpe ratio of 1.21 during the 2023-2024 study period. The benchmark’s concentrated exposure to Bitcoin and Ethereum—the dominant cryptocurrencies—captured momentum during the strong bull market better than the diversified, optimized portfolios. Statistical tests confirmed this difference as significant, with p = 0.007.
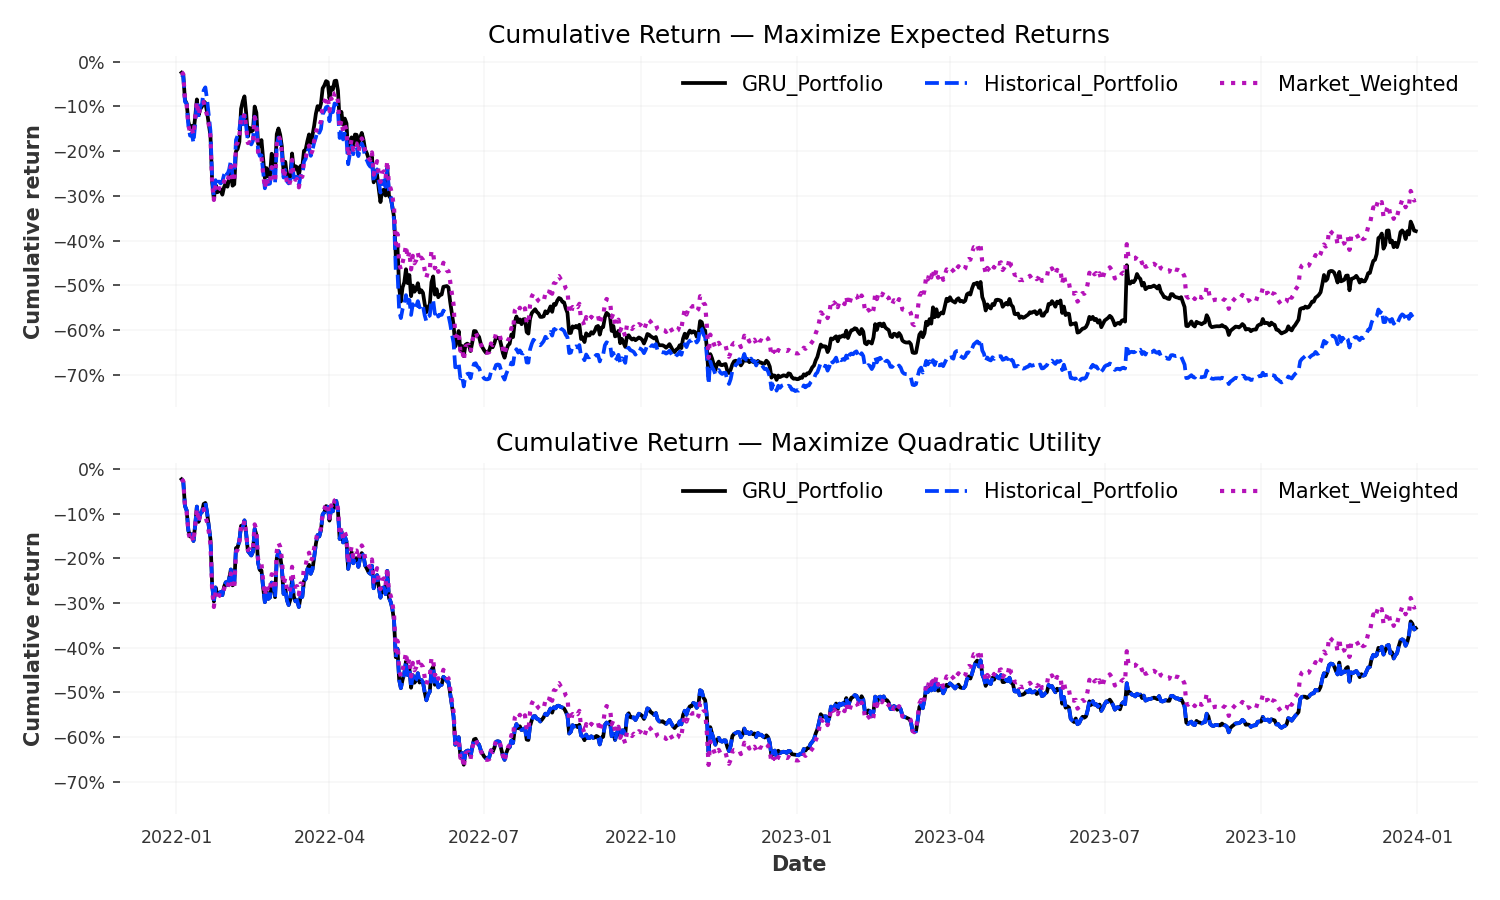 The portfolio performance trajectories tell a nuanced story. The market-weighted benchmark (purple dotted line) achieved higher terminal returns but with visibly greater volatility and deeper drawdowns, particularly during the mid-2022 bear market. The GRU portfolio (solid black line) tracked closer to the historical baseline (blue dashed line) than expected, with both showing smoother paths than the benchmark. Under the Maximize Expected Returns objective (top panel), strategies diverged more than under Maximize Quadratic Utility (bottom panel), where higher risk aversion compressed differences. The visual similarity between GRU and Historical portfolios reinforces the statistical finding: forecast improvements didn’t translate into materially different allocation decisions.
The story wasn’t entirely negative, though. The GRU strategies demonstrated superior risk management, posting maximum drawdowns of 32.1% compared to the benchmark’s 38.7%. During bear market quarters and volatile sideways periods, the neural network’s ability to anticipate downturns provided tangible value. The Calmar ratio—return divided by maximum drawdown—favored the GRU approach (0.88 vs 0.81), suggesting the models succeeded at a different objective than pure return maximization.
Digging into quarterly performance revealed regime-dependent behavior. In strong bull markets, the benchmark’s concentration dominated. In sideways or bearish periods, the GRU’s asset selection advantage emerged. This pattern suggests the system might excel in different market conditions or with different risk mandates than those tested. The complete breakdown appears in the full paper, along with detailed residual analysis and forecast quality metrics by asset.
Why Better Forecasts Didn’t Guarantee Better Returns
The gap between forecasting improvement and portfolio performance teaches several lessons about financial machine learning. Transaction costs provided the most straightforward explanation: at 0.2% per trade, the GRU strategies’ 23% higher turnover translated to 4.6% annual cost drag versus 3.2% for the benchmark. Even modest alpha gets consumed by trading friction.
More subtle was the objective misalignment problem. The models trained to minimize RMSE and maximize direction accuracy, but portfolio optimization maximizes Sharpe ratio—a different goal entirely. Better point forecasts don’t automatically translate into better portfolio inputs when those inputs feed into mean-variance optimization that’s equally sensitive to covariance estimates and constraint handling. This suggests future work should explore training models directly on portfolio objectives rather than prediction metrics.
The cryptocurrency market’s efficiency in the top tier also limited opportunities. Bitcoin and Ethereum are among the most analyzed and liquid digital assets globally. Most predictable patterns have been arbitraged away. The models might find greater success with mid-cap cryptocurrencies where information asymmetries and market inefficiencies provide more exploitable signals. Testing this hypothesis remains on my agenda for future research.
Finally, the study period’s strong bull market obscured risk management benefits. When nearly everything rises, concentration beats diversification and simple momentum strategies shine. The GRU system’s 6.6 percentage point lower drawdown matters more to institutional investors with strict risk mandates than to retail participants chasing returns. In a different market regime—particularly extended bear markets or high-volatility periods—the same system might show more compelling performance differences.
What This Research Demonstrated
Beyond the specific findings about GRU models and cryptocurrency trading, this project proved several broader points about production machine learning for finance. End-to-end evaluation is essential. Most academic papers stop at prediction metrics, but real trading performance depends on the entire pipeline from data quality through portfolio construction. Evaluating components in isolation produces incomplete conclusions.
Walk-forward validation isn’t optional for time series. The temptation to use simpler train/test splits or k-fold cross-validation is strong because they’re computationally cheaper and conceptually simpler. But temporal data leakage produces dangerously optimistic results that evaporate in live trading. The quarterly retraining requirement discovered through walk-forward validation has direct implications for operational costs and infrastructure design that wouldn’t emerge from standard approaches.
Statistical significance testing separates signal from noise. Without hypothesis testing, the 4% Sharpe improvement might have been presented as success. Rigorous statistical validation revealed it as likely noise. This discipline prevents the kind of overfitting to historical periods that plagues quantitative finance.
The complete methodology, including all hyperparameter search spaces, optimization procedures, and statistical tests, appears in the research paper. The paper also includes comprehensive results tables, forecast residual distributions, and quarterly performance breakdowns across different market regimes that space constraints prevent including here.
Lessons for Quantitative Finance
This experience reinforced that markets are fundamentally different from typical machine learning benchmarks. On Kaggle, lower test set error means better performance. In trading, better predictions must survive transaction costs, portfolio constraints, estimation errors, and regime changes to deliver value. The gap between these environments is wider than many data scientists initially appreciate.
For practitioners considering deep learning in production trading systems, several insights emerged. First, focus on where models can add unique value. In highly efficient, liquid markets, beating simple benchmarks requires extraordinary edge. Look for market segments with genuine information asymmetries and inefficiencies. Second, align model objectives with portfolio goals from the start. Training on standard regression metrics then hoping they translate to Sharpe ratios introduces unnecessary indirection. Third, build infrastructure for continuous retraining and monitoring. Static models degrade quickly in financial markets.
The individual repository pages provide implementation details for teams building similar systems: kallos-data covers the ETL pipeline and feature engineering, kallos_models explains the training infrastructure and hyperparameter optimization, and kallos_portfolios documents portfolio construction and backtesting. Together they form a template for production ML systems in finance.
Future Directions
Several promising extensions could build on this foundation. Ensemble methods combining GRU with LSTM and Transformer architectures might improve robustness across different market conditions. Regime detection systems could dynamically adjust strategies based on whether markets are trending, mean-reverting, or highly volatile. Expanding the universe to mid-cap cryptocurrencies where efficiency is lower could reveal stronger advantages for sophisticated modeling.
More fundamentally, reinforcement learning approaches that directly optimize trading decisions rather than forecasts might circumvent the objective misalignment problem. Rather than predicting prices then constructing portfolios, an RL agent would learn portfolio allocations directly through reward signals based on Sharpe ratio or other trading metrics. This represents a different paradigm than the forecast-then-optimize approach tested here.
The paper’s limitations section outlines several constraints of the current work—from the limited five-asset universe to the simple mean-variance optimization framework—and proposes specific enhancements for each. Interested researchers will find detailed suggestions for extending this work in multiple directions.
The Bottom Line
Does deep learning add value to cryptocurrency portfolio management? The honest answer is: sometimes, but not as much as you might expect from forecasting accuracy alone. The GRU system achieved measurably better predictions and demonstrably superior risk management, yet failed to deliver statistically significant return improvements after accounting for costs and constraints.
This result is actually more valuable than unambiguous success would have been. It demonstrates the importance of end-to-end evaluation, reveals specific mechanisms where forecasting improvements get lost in translation to trading performance, and highlights where deep learning might add value (risk management, regime-specific conditions) versus where simpler approaches suffice.
For institutional investors with risk mandates and lower transaction costs, a system like Kallos might justify deployment. For retail investors, the computational expense and operational complexity likely exceed the modest benefits. The choice depends on context, constraints, and objectives—exactly as thoughtful quantitative finance should be.
The complete research paper, including comprehensive methodology, results tables, statistical tests, and limitations, is available below. The three GitHub repositories contain production-ready code implementing each system component, suitable for replication or extension.
Resources
Research Paper: Download Complete Paper (PDF)
System Components:
- Kallos Data Pipeline — ETL infrastructure and feature engineering
- Kallos Models — GRU training and hyperparameter optimization
- Kallos Portfolios — Portfolio construction and backtesting
Code Repositories:
- github.com/josemarquezjaramillo/kallos-data
- github.com/josemarquezjaramillo/kallos_models
- github.com/josemarquezjaramillo/kallos_portfolios
Technologies: PyTorch, Darts, Optuna, PostgreSQL, vectorbt, PyPortfolioOpt, QuantStats, PyTorch Lightning
Citation:
Márquez Jaramillo, J. (2024). Evaluating GRU-Powered Trading Systems:
The Case of Cryptocurrency Markets. Johns Hopkins University,
EN.649.740 Machine Learning: Deep Learning.
This project demonstrates production-grade MLOps practices, rigorous statistical validation, and the practical challenges of translating forecasting improvements into investable alpha. It was completed as the capstone for EN.649.740 Machine Learning: Deep Learning at Johns Hopkins University.